

BUSINESS INTELLIGENCE
Reporting
Eagle3D reports are built on the cost saved with every order line, so each figure reflects real profit. Five reports compare printers, products, months, cities and sales channels over a chosen period and show profit per print hour, while the dashboard flags overdue orders and low stock.
Operations Dashboard
Start the day with the numbers that need attention.

The dashboard shows the order and money figures that matter today at a glance. It is the first screen of the day for an owner and the shared status board for a team.
Order counts. Total orders, orders in progress, customers and products.
This month's figures. Revenue and profit for the current month, read from the saved order-line costs.
Outstanding balance. Money still owed across orders that are not cancelled.
Status, recent orders and best sellers. An order status breakdown, the eight most recent orders and the top-selling products of the last 30 days.
Overdue and low-stock alerts. Orders past their due date and not yet shipped, and stock items below their threshold, appear as alerts at the top.
Low-stock alerts require the optional stock module described on Stock Deduction and Low-Stock Alerts.
Machine and Capacity Report
Find out which printers earn their keep.

The Machine Production Report shows print hours, occupancy and profit per hour for each printer. Because machine time is the real limit of a print shop, the report tells you which machines are busy, which are idle and which produce the most profit for the hours they run.
- Print hours over the chosen period.
- Occupancy against capacity: printer daily hours × utilization × working days per month, scaled to the days in the period.
- Profit per hour per printer: profit divided by print hours.
Every report offers this month, last month, the last 3 or 12 months, this year, all time or a custom range, and keeps the period when you switch reports. Cancelled orders are excluded. Printer hours and capacity come from the profiles maintained on Printer Profiles.
Product Profitability and ABC Analysis
See which products drive profit and what each one really costs.
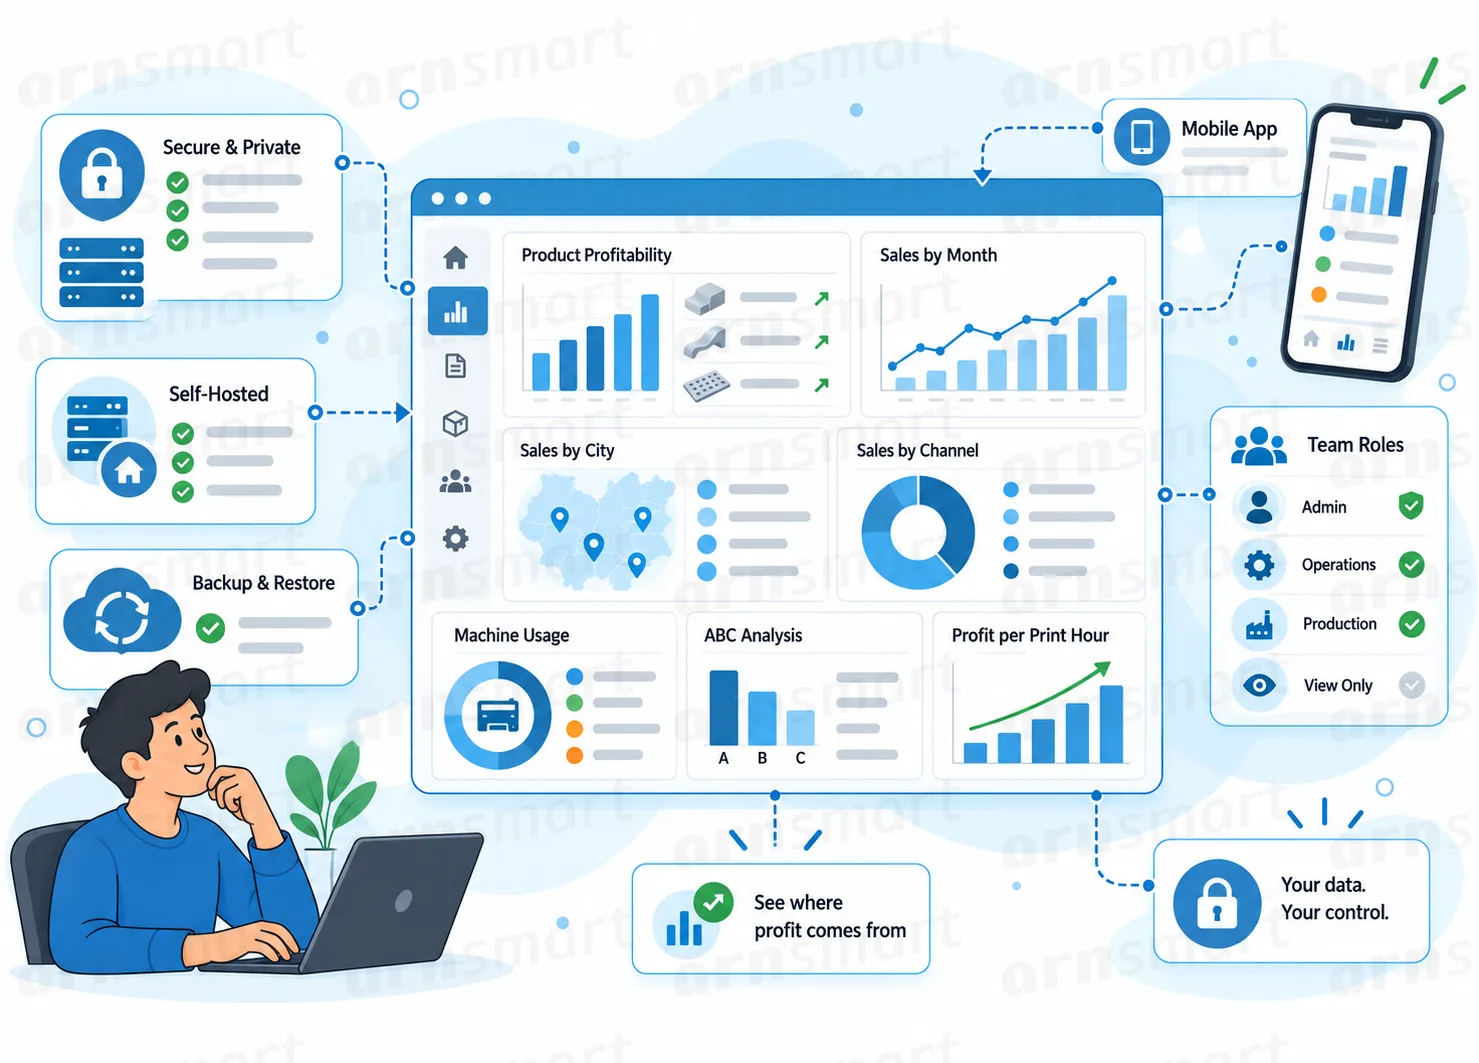
The Product Report lists each product with its revenue, cost parts and profit. The ABC Product Report ranks products by profit, so the catalog can be reviewed in order of importance rather than alphabetically.
Product profitability with cost breakdown. List price, average sale price, discount given, production cost, overhead, channel and order cost and profit per product; a product name opens its monthly breakdown.
ABC analysis. Products bringing the first 80 percent of total profit are class A, the next 15 percent class B, and the rest, including products without profit, class C.
Below-cost products. Products whose current price does not cover their cost show a red profit in the product list described on Margin, Markup and Below-Cost Products.
Figures use the cost saved on each order line, not a recalculation at report time.
Sales by Month, City and Channel
Compare periods, places and channels on the same profit basis.

The Sales & Profit Report shows the period's orders, revenue, cost and profit with a monthly breakdown, the top cities and the sales channels. Channel figures include the commission and fees defined for each channel, so a busy marketplace and a quiet storefront are compared on what they leave after costs.
| Report part | Question it answers |
|---|---|
| Monthly breakdown | How did revenue and profit change month by month? |
| Top 10 cities by revenue | Where do the orders come from? |
| Sales channels | Which channel leaves the most profit after commission and fees? |
Channel definitions are maintained on Sales Channels, Taxes and Categories.
Efficiency Matrix
Put profit per print hour against sales volume to decide what to print more of.
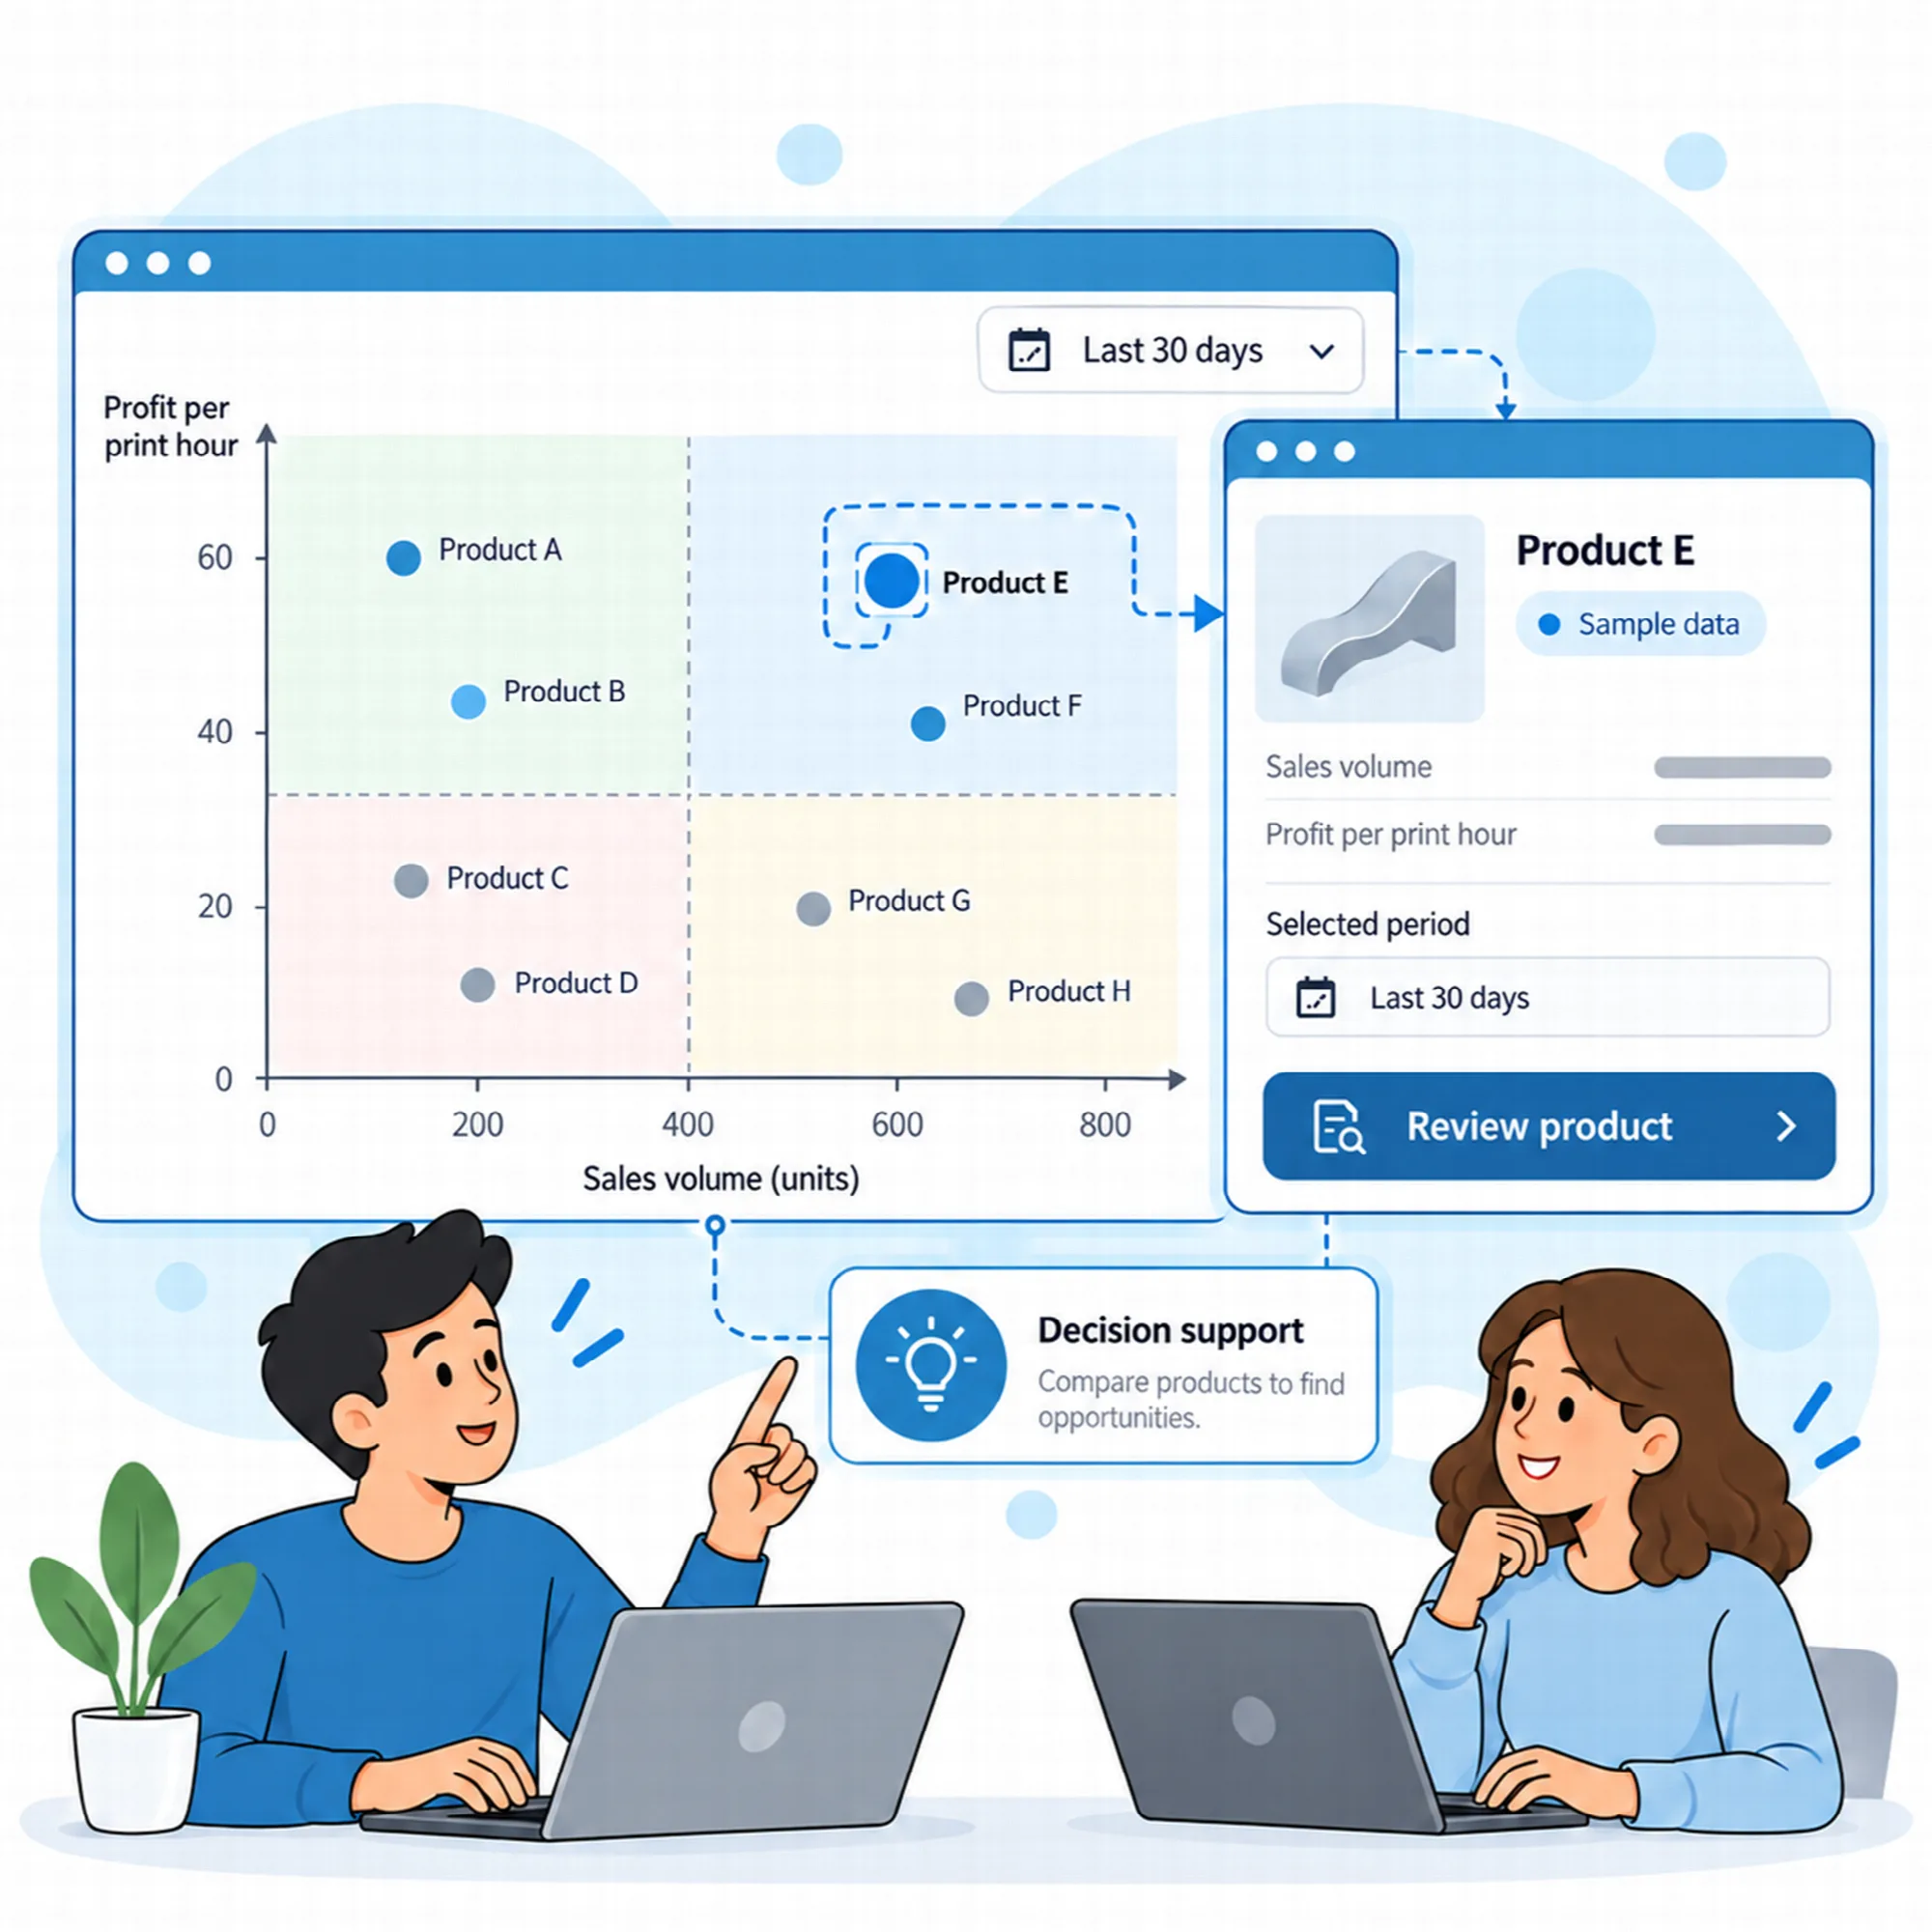
The Efficiency Report sorts products into four groups by comparing their profit per print hour and units sold with the medians of the period. A product that sells often but ties up printers for little profit lands in a different group from a product that sells rarely but earns well per hour.
| Group | Meaning |
|---|---|
| Star | Earns a lot per hour and sells a lot |
| Profit Pearl | Earns a lot per hour but sells little |
| Workhorse | Sells a lot but uses machine time poorly |
| Review | Sells little and earns little per hour |
Products not sold in the period. Listed separately with a theoretical profit per hour from the list price and current recipe cost.
Same saved-cost basis. Profit per order, product, printer and channel is read from the same saved order-line costs in every report.
The groups support a decision; they do not change prices or production on their own.
A Practical Reporting Workflow
- Open the dashboard and clear overdue orders and low-stock alerts first.
- Review the machine report to see which printers are near capacity and which are idle.
- Check the product report and the ABC ranking before changing prices.
- Compare channels after commission and decide where to invest marketing time.
- Use the efficiency groups to choose which products deserve more printer hours.
Questions About Reporting
Are report figures recalculated when costs change?
No. Reports read the cost saved on each order line, so historical profit does not shift when filament prices or rates change.
Can reports be limited to a date range?
Yes. Each report offers preset periods and a custom range, and the chosen period stays when you switch between reports.
What does profit per print hour show?
It divides the profit of a product or printer by the printer time consumed, so machine time, the main limit in a print shop, is used as the comparison basis.
Who can open the reports?
Administrators and view-only users. The operations and production roles work without the Reports menu; see Users and Roles.
Continue Your Eagle3D Workflow
Reviewed against Eagle3D 2.0.0 · Last updated 29 October 2026